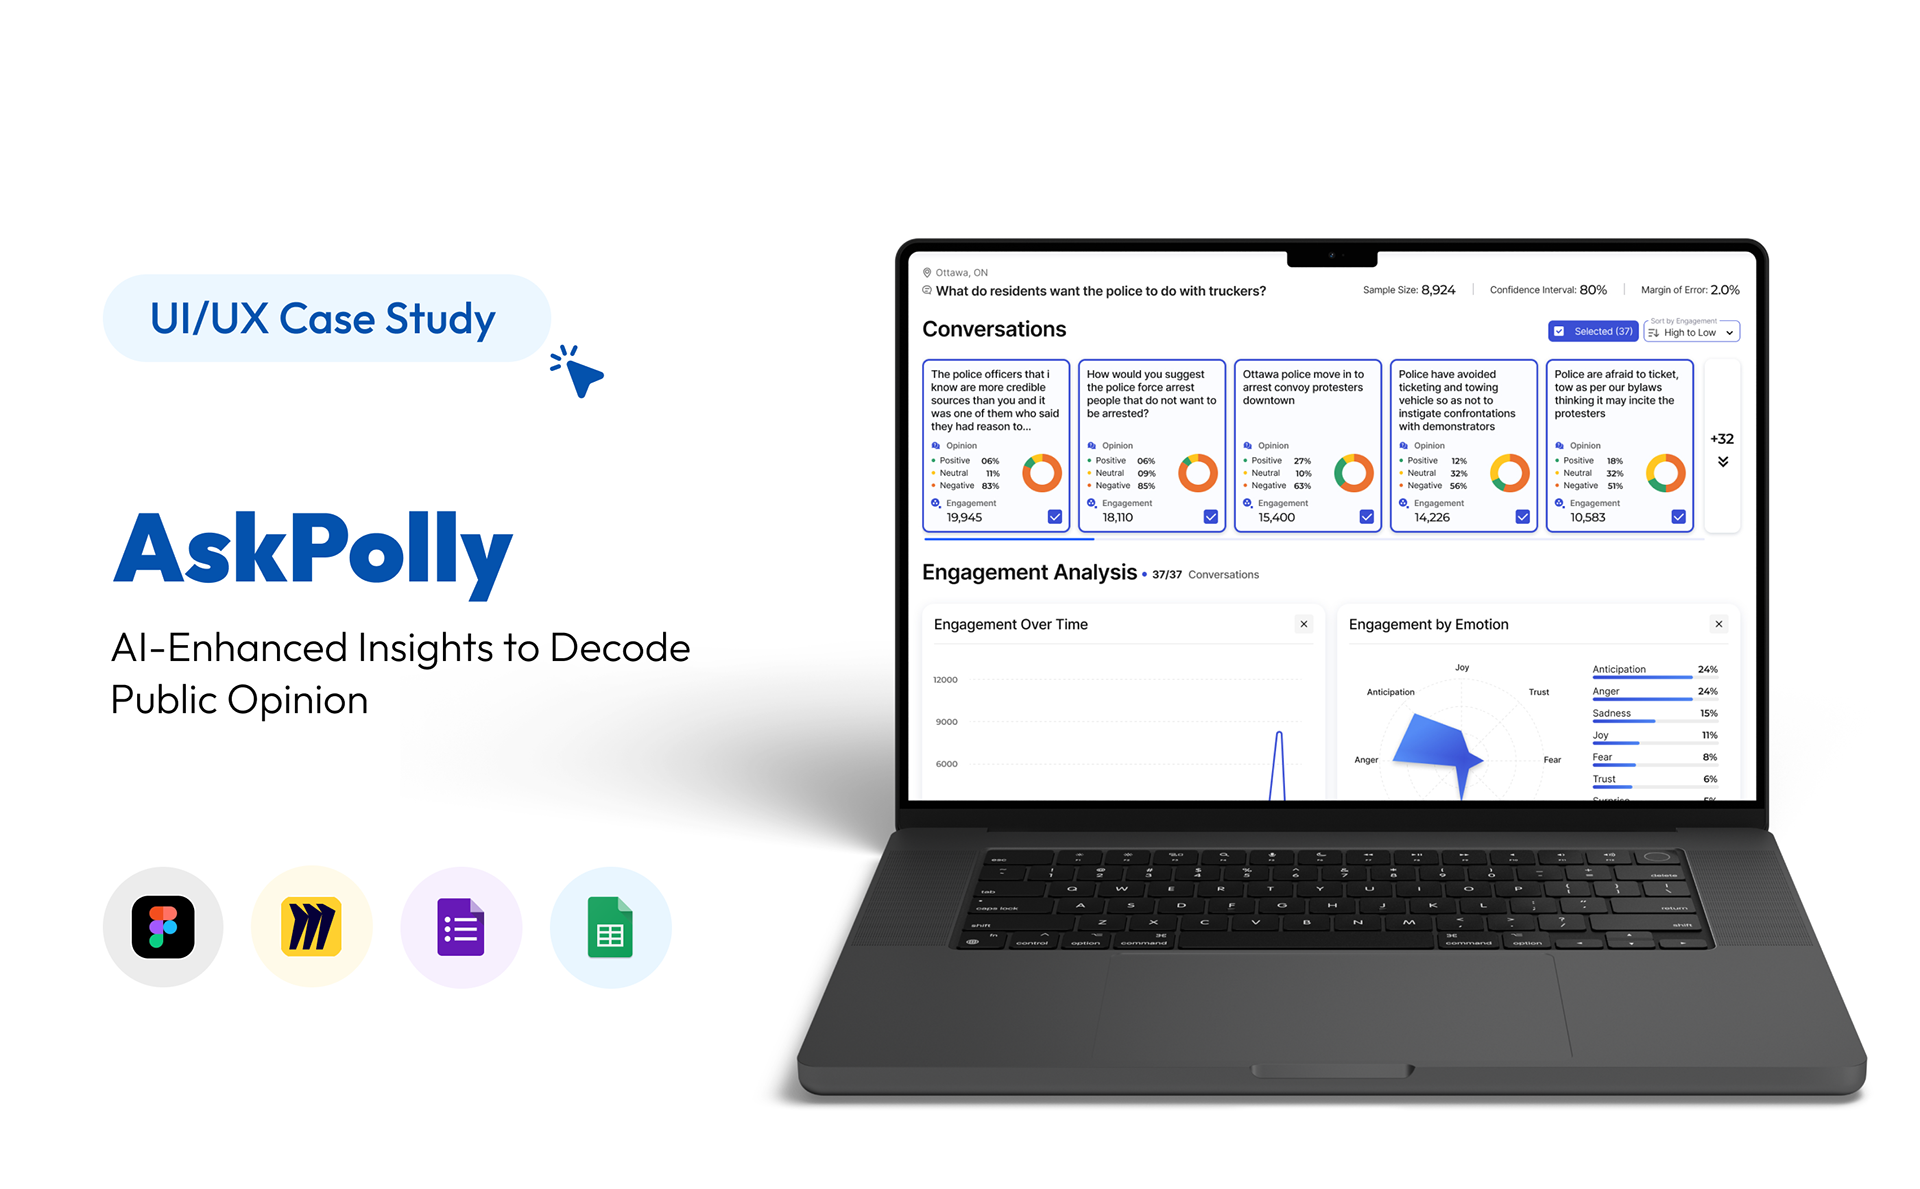
AskPolly: Decoding Public Opinion with AI Precision
AskPolly is an AI-driven platform that decodes public opinion and sentiment by analyzing online discussions. It offers businesses, researchers, and marketers real-time insights through a user-friendly interface, customizable data visualizations, and advanced analytics. This empowers users to make data-driven decisions and stay ahead in understanding public sentiment on topics, events, or locations.

The Problem
Project Goal
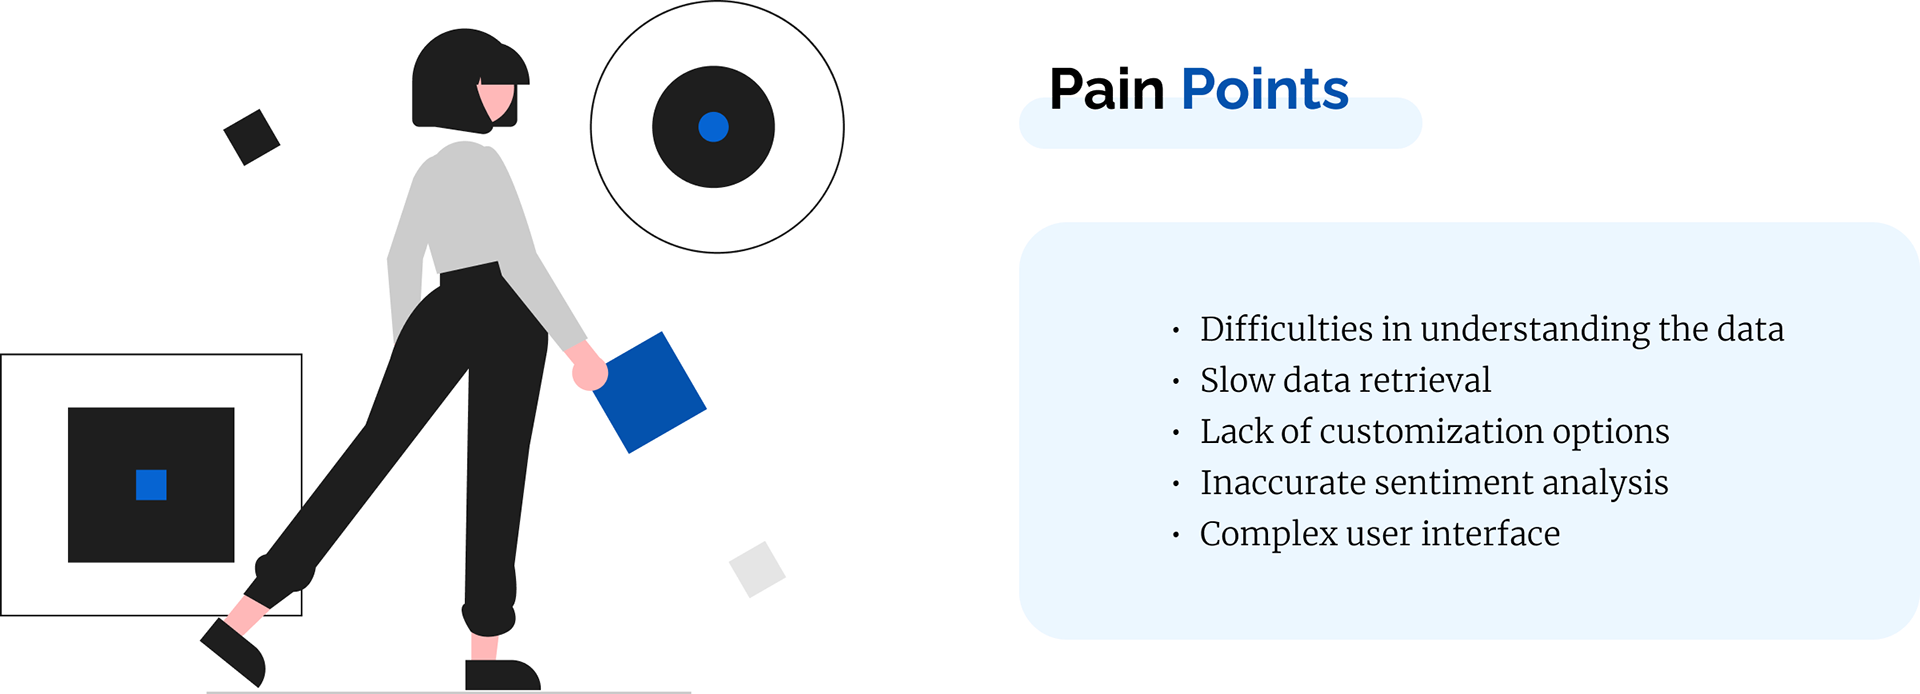
AskPolly’s design was complex and hard to navigate, making it difficult for users to access insights. Processing was slow, with no progress updates, leaving users frustrated. The overloaded dashboard was overwhelming and lacked customization options, preventing users from tailoring data to their needs. These issues reduced the platform's usability and appeal as a market research tool.
The goal of the AskPolly project was to enhance the user experience by resolving key pain points. This involved streamlining the search process, improving loading times with progress indicators, and redesigning the dashboard for clearer, more digestible data presentation. The project also focused on adding customization options, empowering users to tailor visualizations to their specific needs.
My Responsibilities
User Research: Conducted interviews and usability testing to identify pain points and user needs.
Information Architecture: Organized content to improve navigation and simplify data access.
Wireframing & Prototyping: Designed low-fidelity wireframes and interactive prototypes for user feedback.
Visual Design: Created a modern, user-friendly interface with clear data visualization.
Collaboration: Worked closely with developers and stakeholders to align on design goals and implement changes.
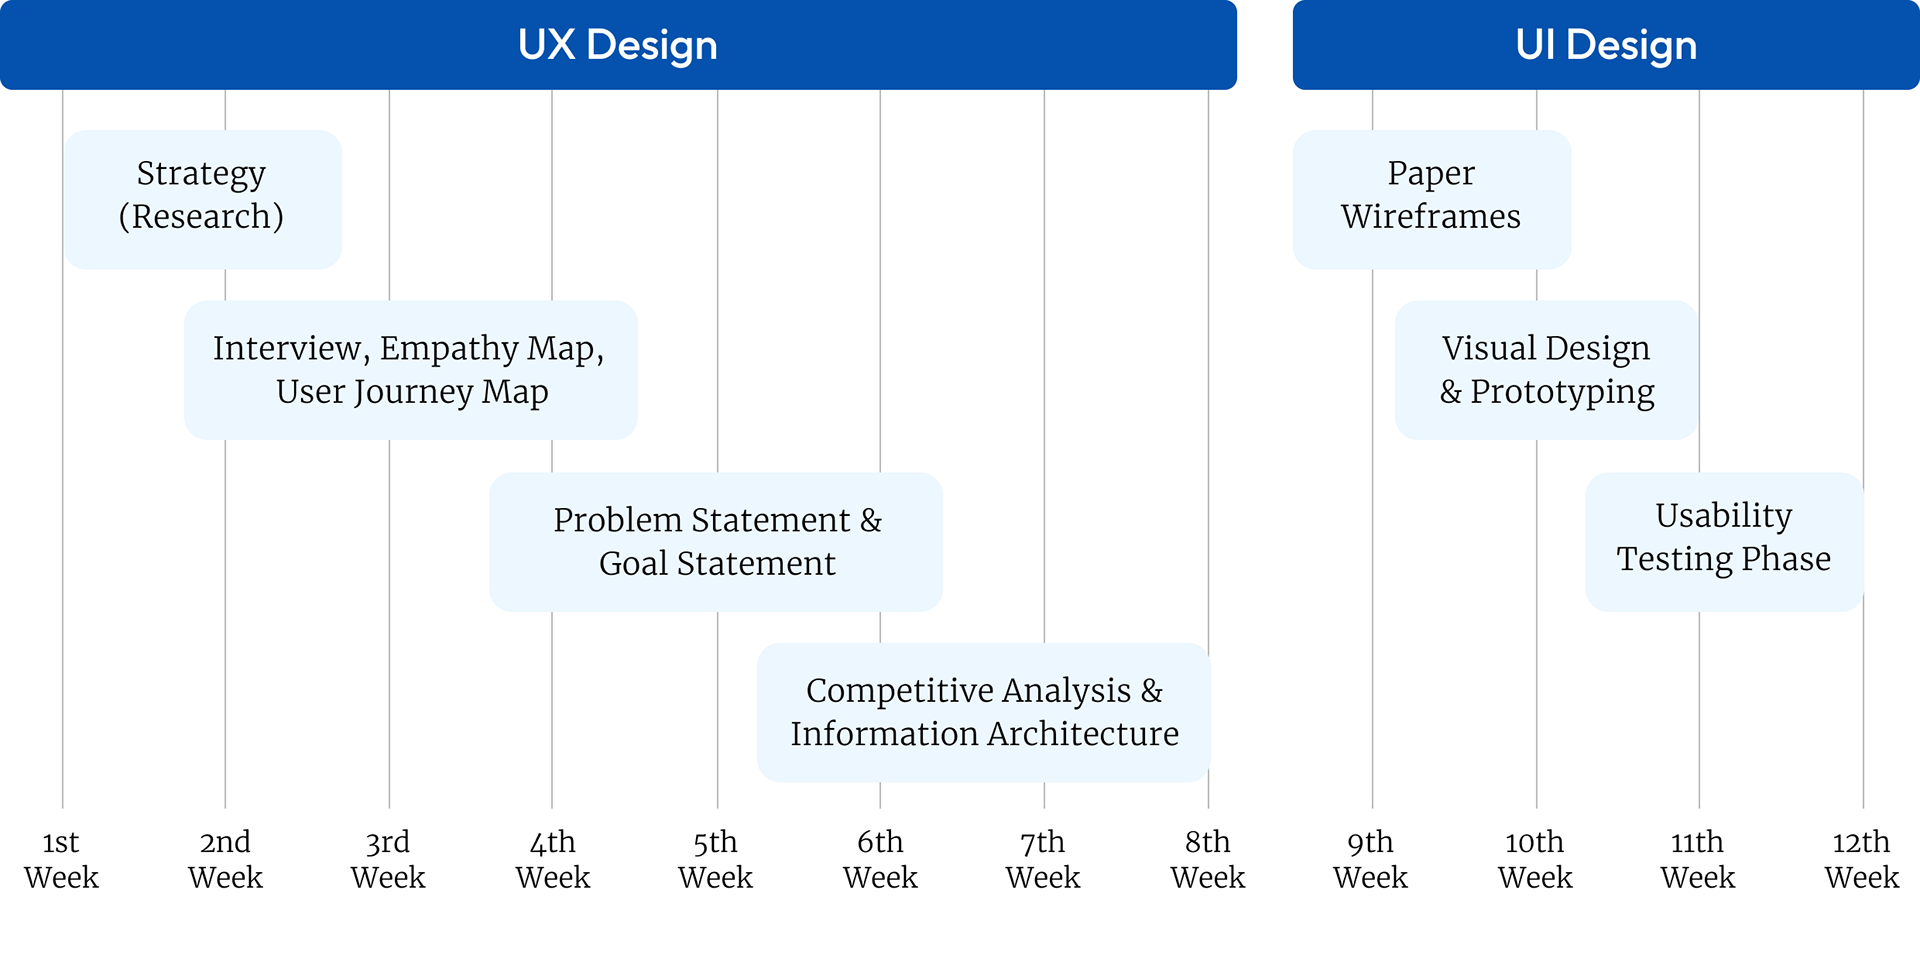
The Process
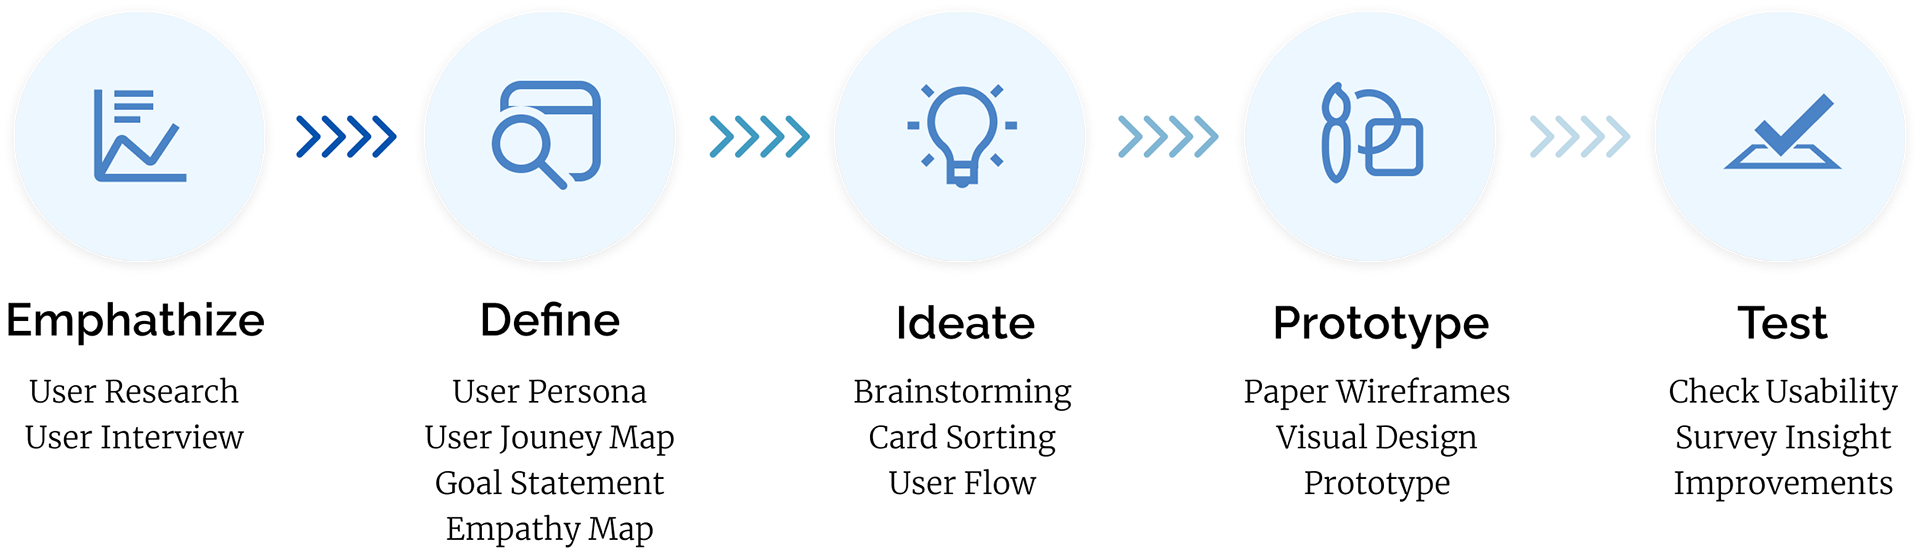
Project Timeline
Qualitative Research
To conduct qualitative research for the AskPolly project, we used semi-structured interviews to gather in-depth insights from users about their experiences and expectations when using a market research tool like AskPolly.
Key Insights
1. Market research tools were often complex, making queries and results hard to manage.
2. Users wanted more control over data presentation with customizable dashboards.
3. Long wait times and no progress updates caused frustration and uncertainty.
4. A clear, concise dashboard was essential to avoid overwhelming users.
5. Demographic data, sentiment analysis, and trend insights were highly valued for informed decision-making.
Quantitative Research


Key Insights
1. Most users (85%) have experience with market research tools.
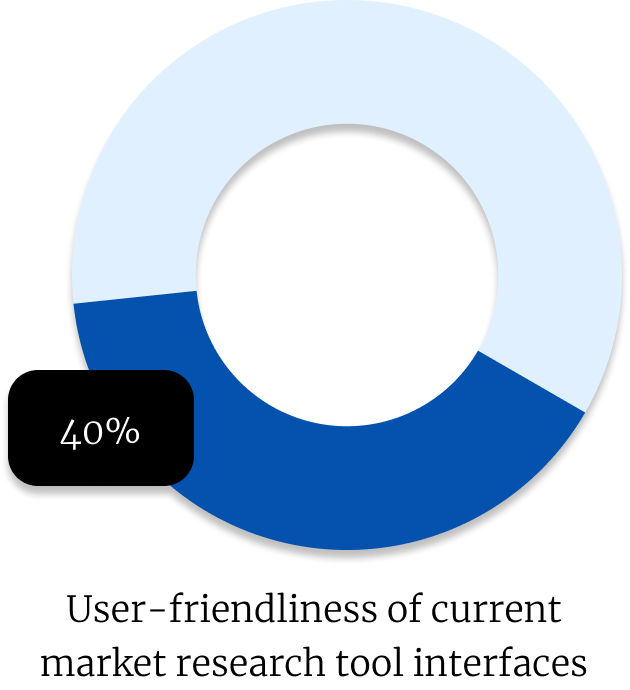
2. Majority of users (60%) find current tool interfaces not user-friendly.
3. Customization is important, as 75% want this feature in their tools.
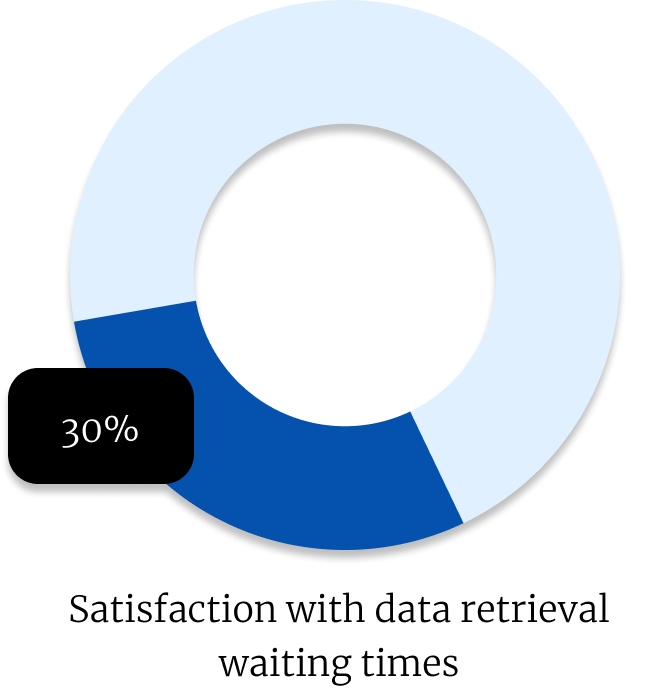
4. Only 30% are satisfied with data retrieval waiting times.
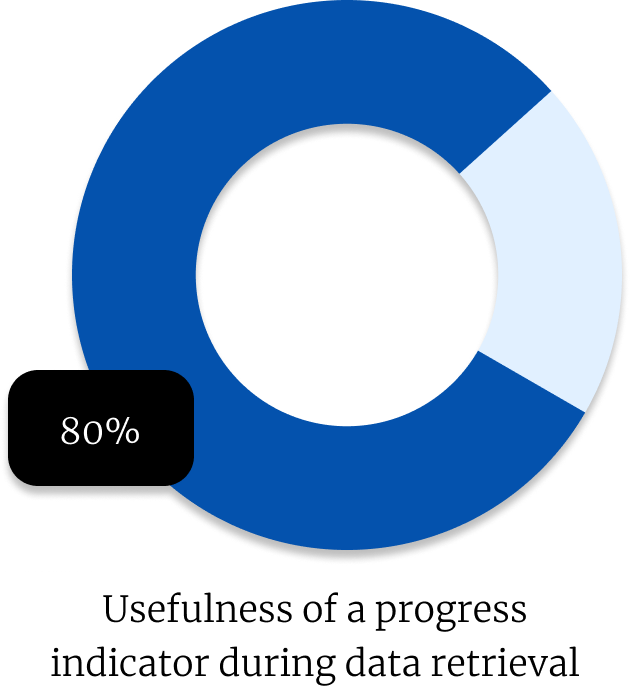
5. A progress indicator is considered helpful by 80% of respondents.
2. Majority of users (60%) find current tool interfaces not user-friendly.
3. Customization is important, as 75% want this feature in their tools.
4. Only 30% are satisfied with data retrieval waiting times.
5. A progress indicator is considered helpful by 80% of respondents.

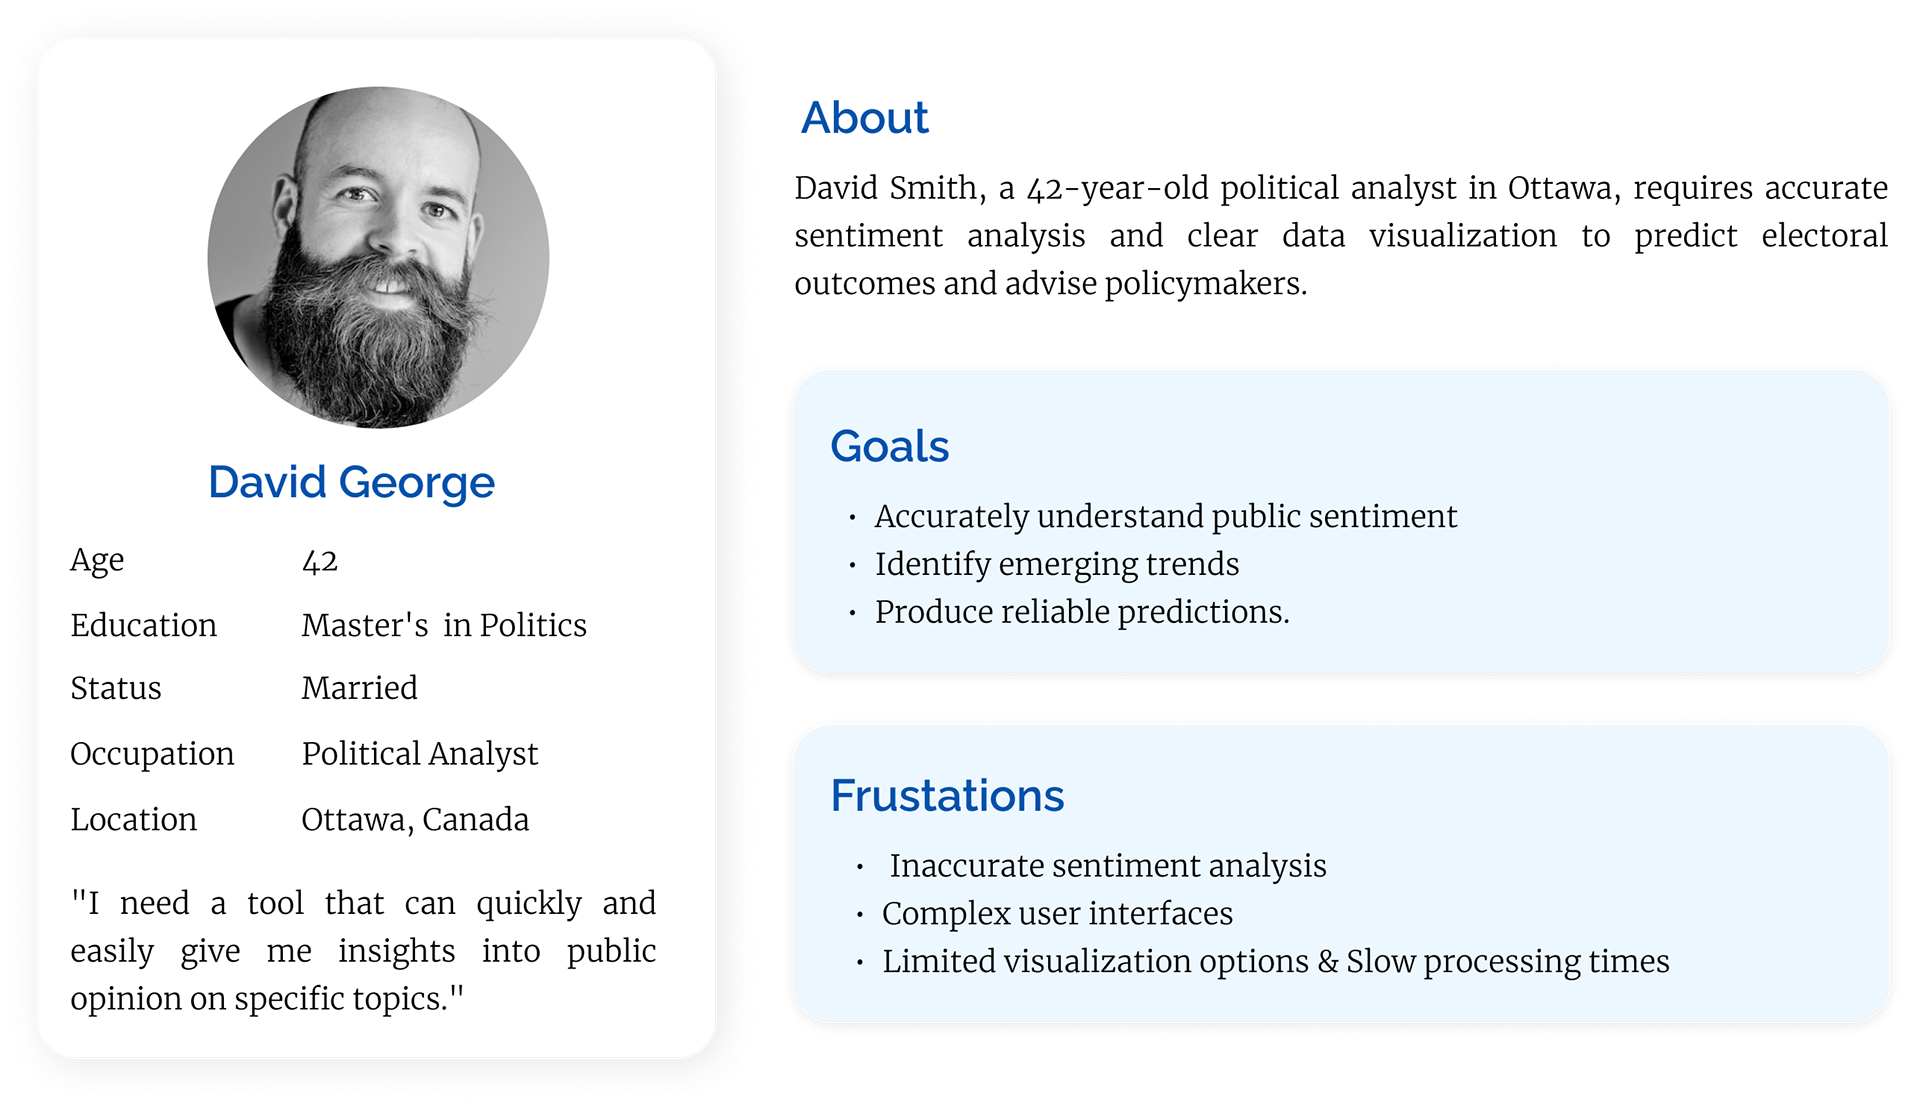
User Personas

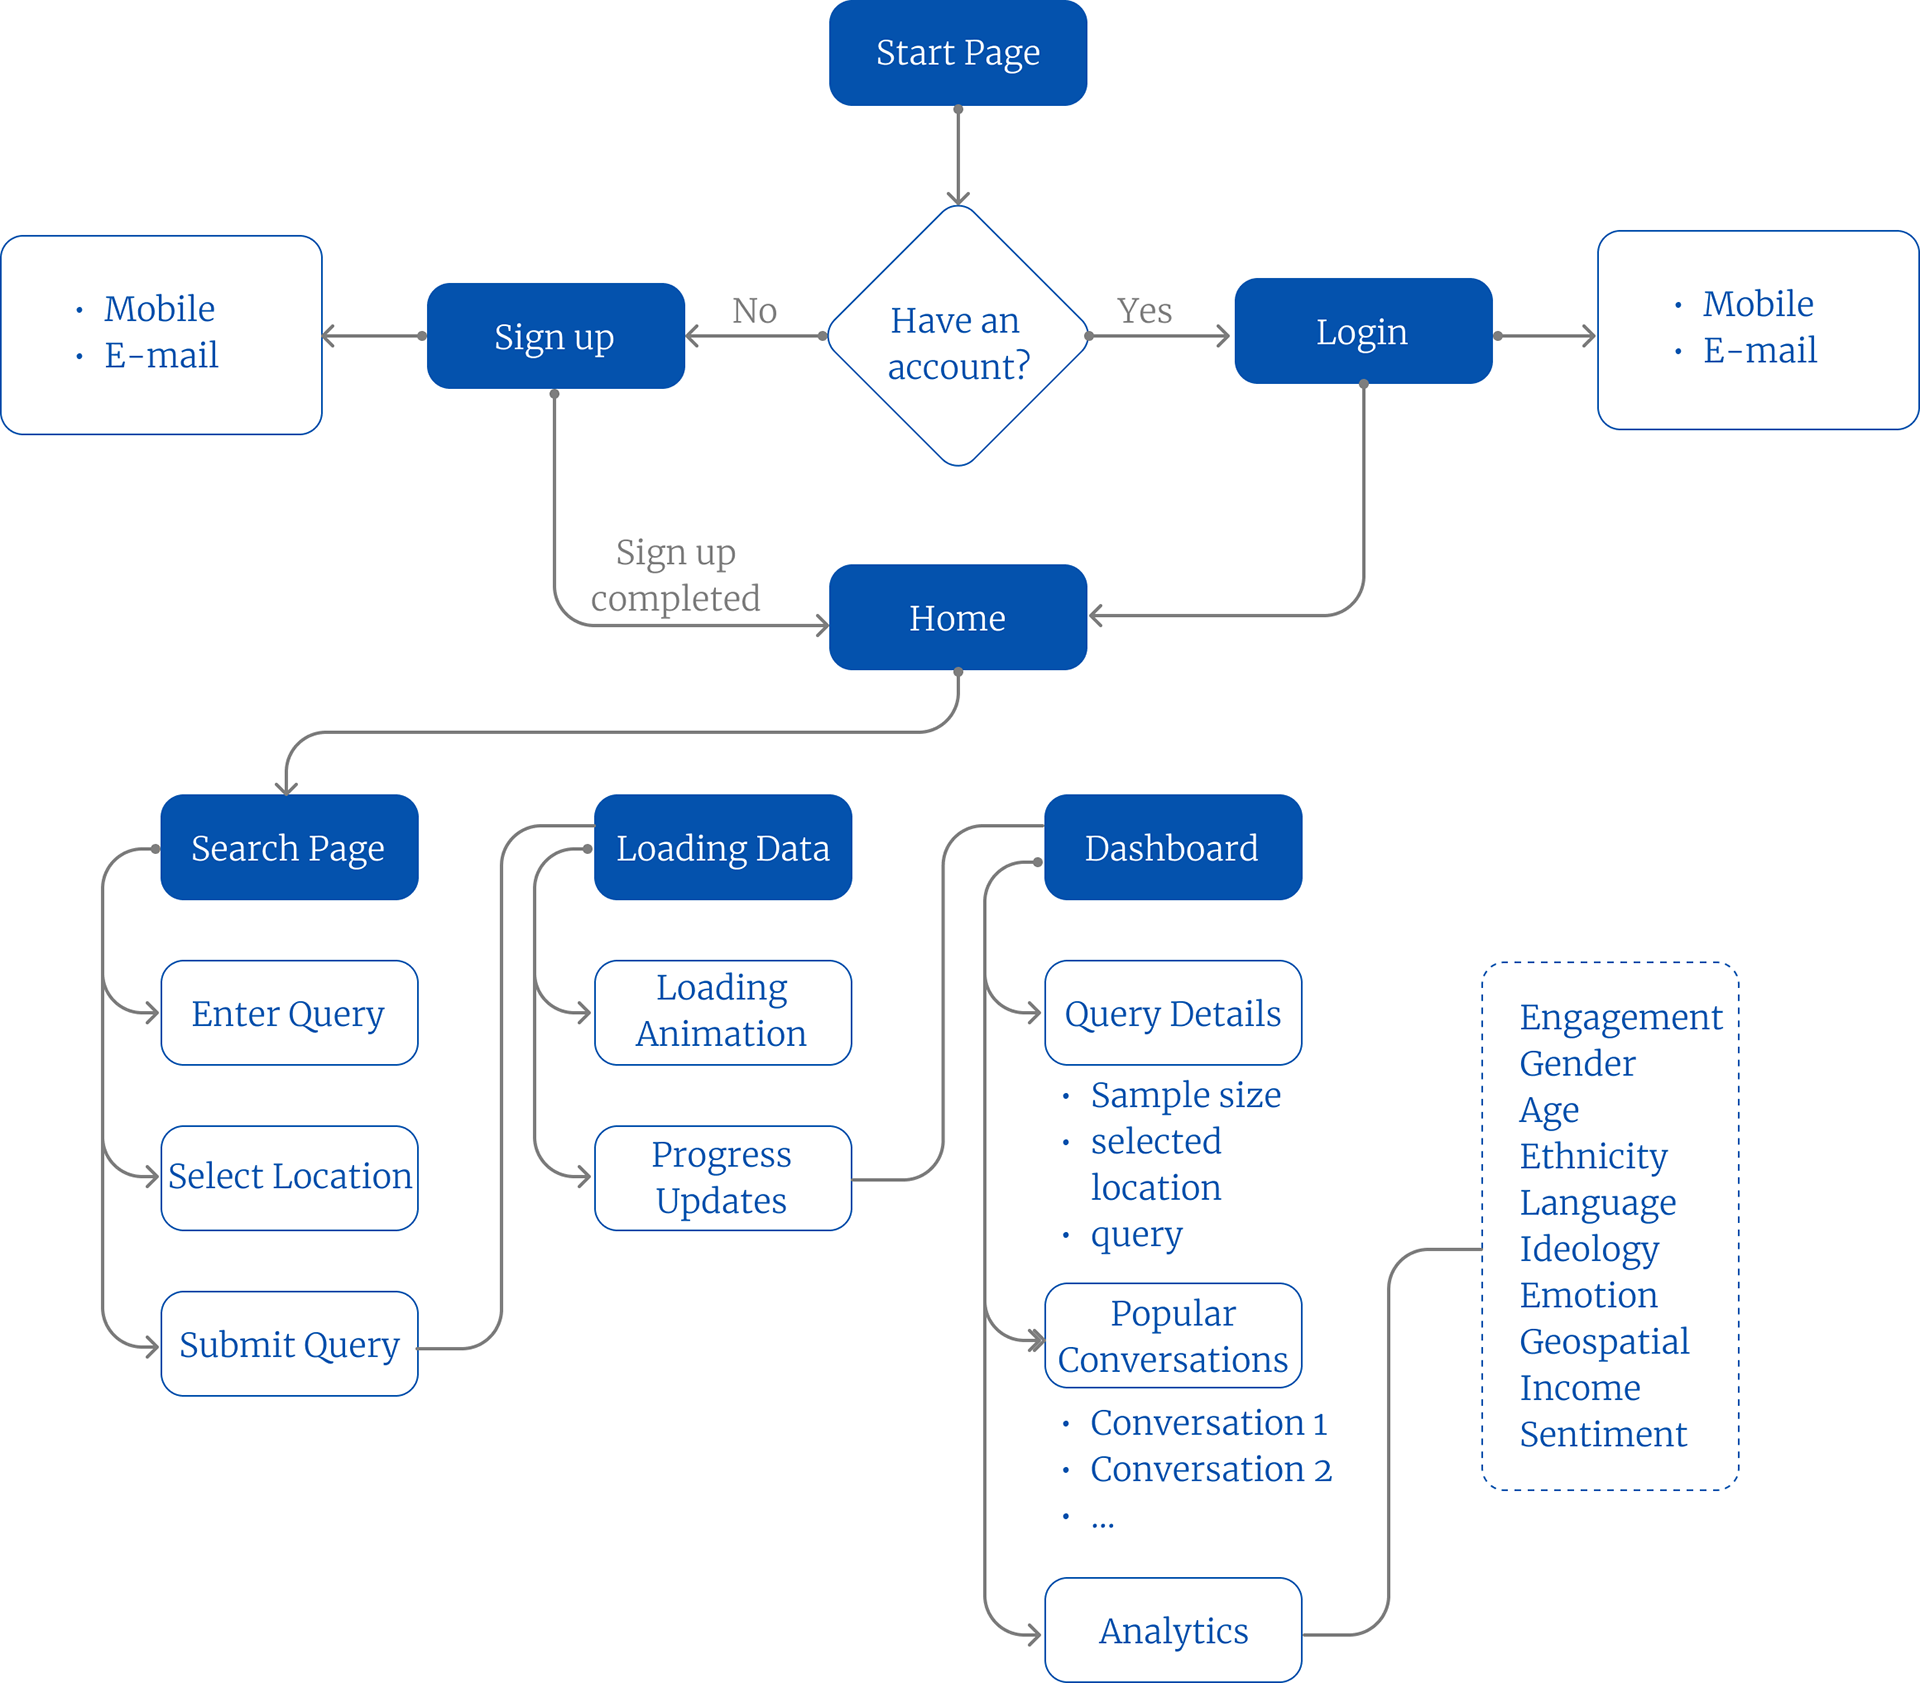
Information Architecture
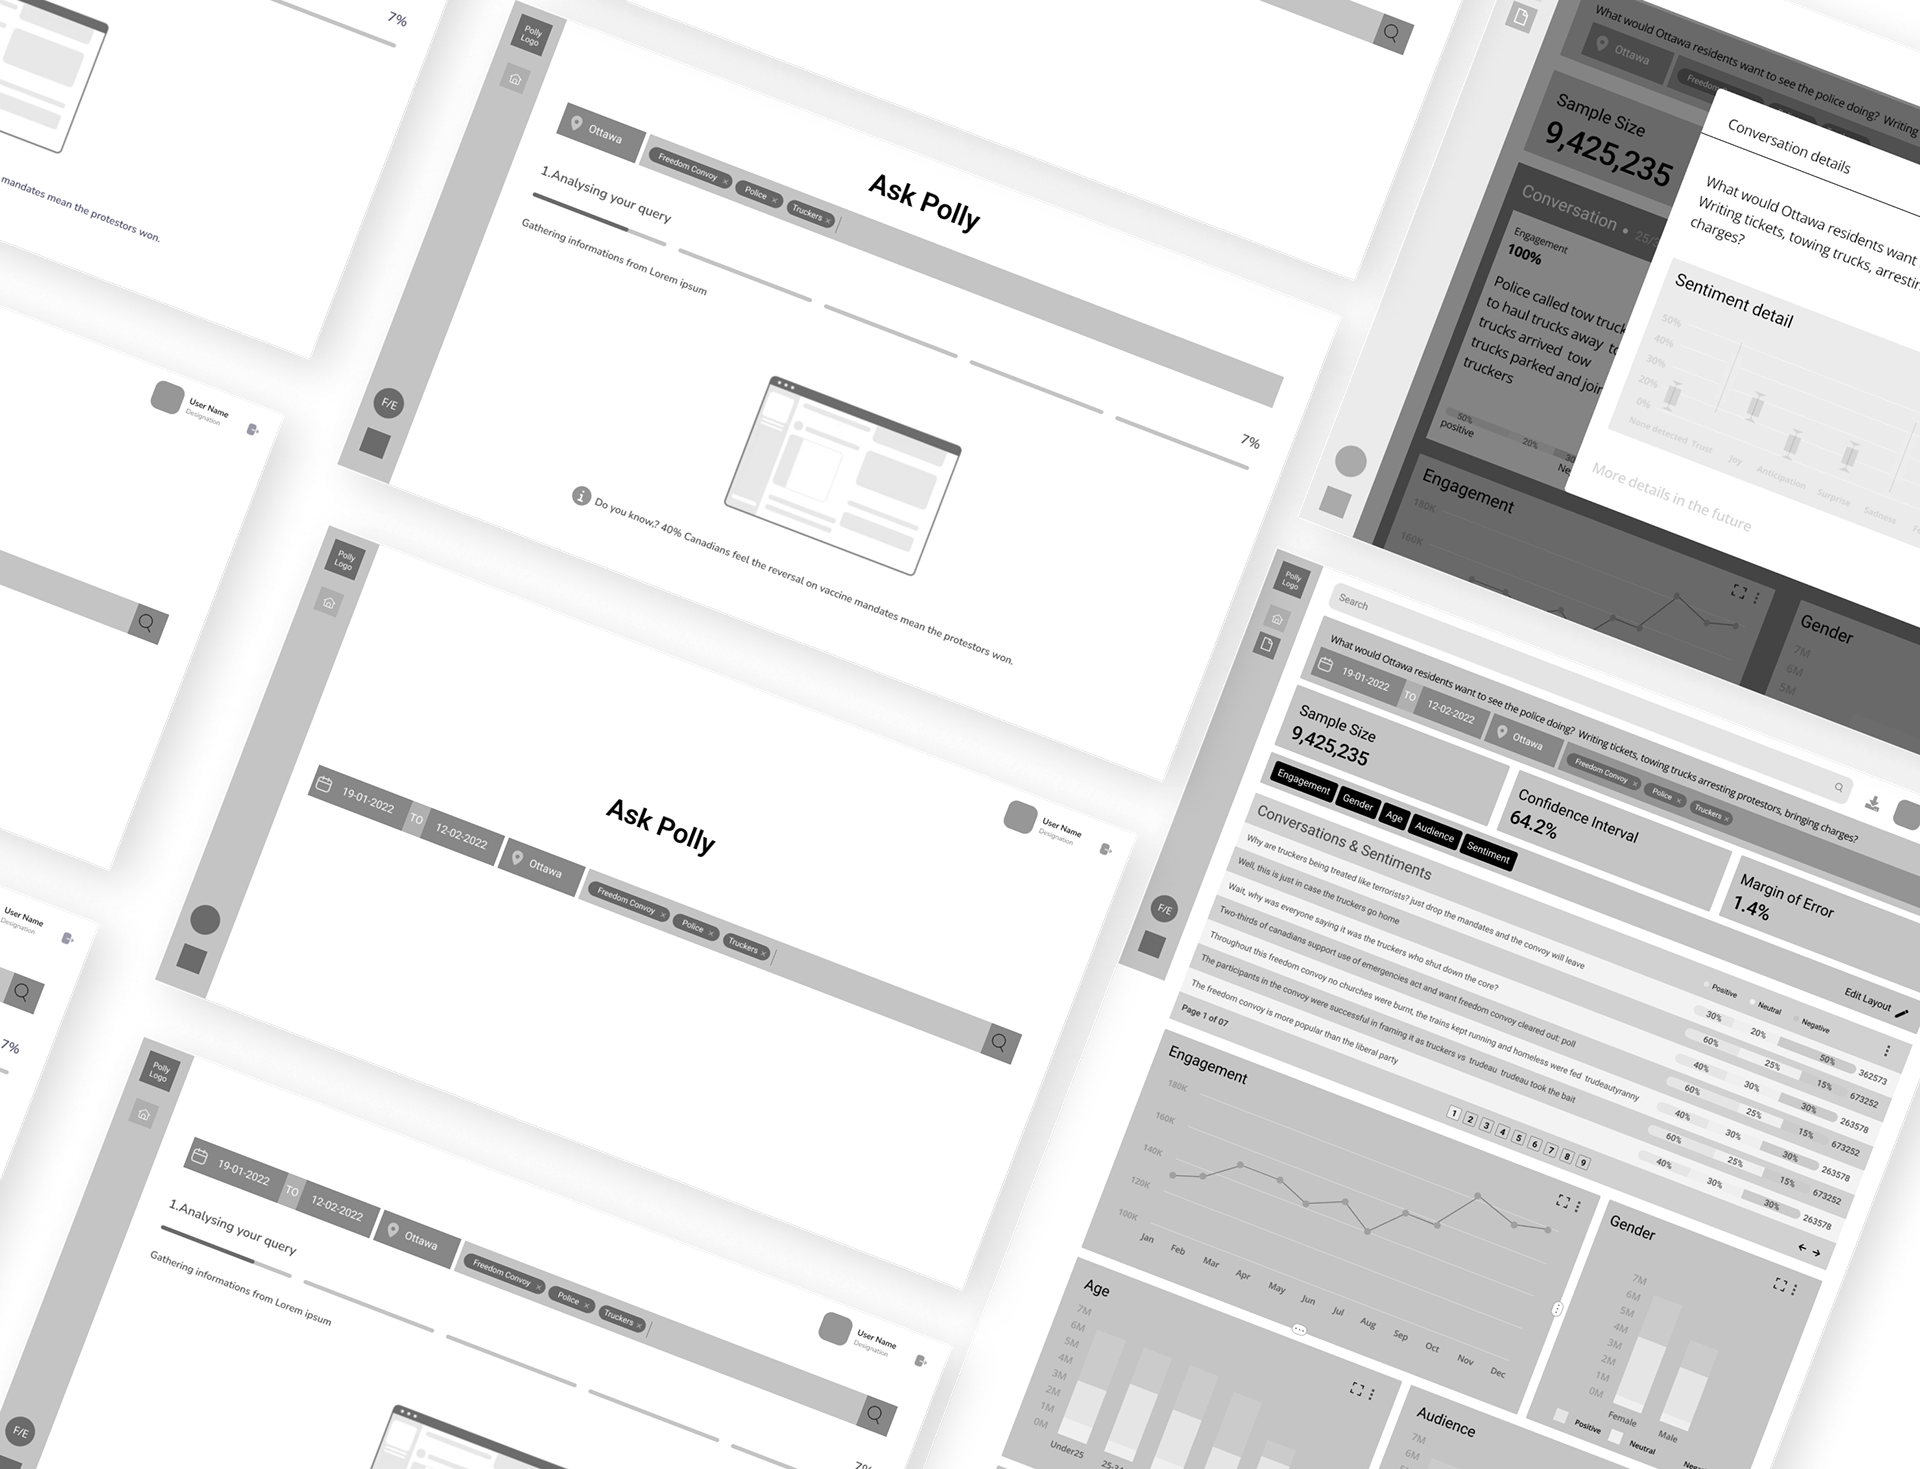
Low-Fidelity Wireframes
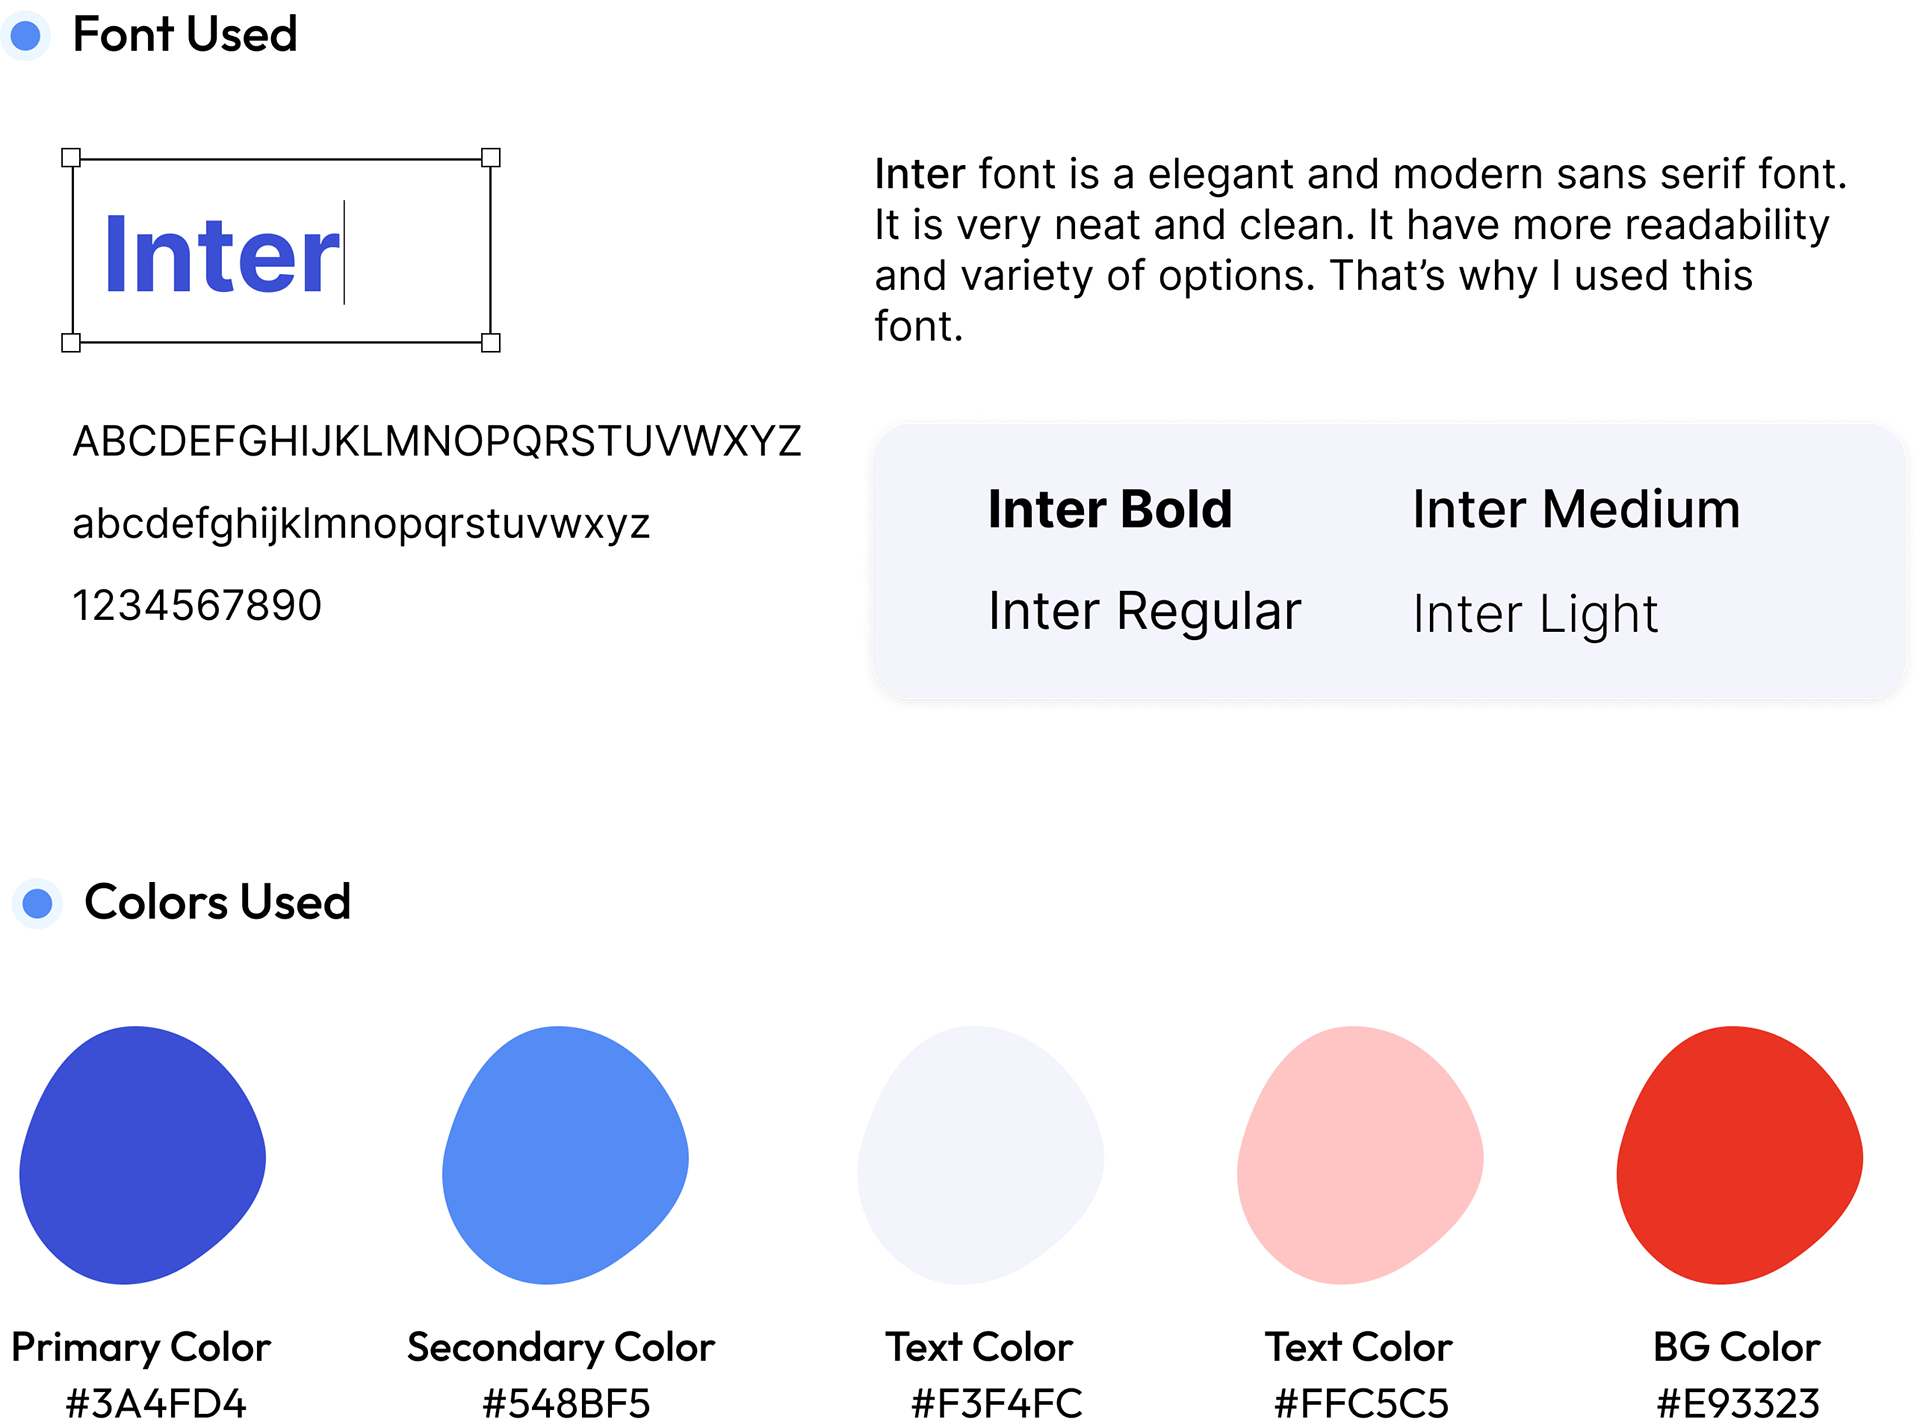
Typography & Colors

Key Takeaways
• Simplified user interface and search functionality improves user experience and engagement.
• Engaging loading interactions help retain user attention during data retrieval.
• Card-based design for displaying conversations allows for easier consumption of information.
• Customization options for data visualization and layout cater to diverse user needs and preferences.
• Implementing accessibility features ensures a more inclusive user experience.


Thank you for your time!
Feel free to provide your valuable suggestions and comments at
joyatjoseph619@gmail.com
joyatjoseph619@gmail.com